Pages

Welcome to Jesus' Math Blog

Welcome to Jesus' Math Blog
Everything you need for Math Analysis is right here!

Monday, May 19, 2014

BQ # 6 Unit U Limits

1. Continuity is when there is a graph that is predictable, meaning that you know what the graph will do, it will not surprise you. Continuity is also when a graph has no breaks, no jumps, no holes that makes the graph look abnormal. a continuous graph can be drawn without lifting up your pencil.  A continuous graph also has it's value and limits equal the same.  The picture below shows various continuous graphs. As you can see, you can notice that all of these graphs are plain and predictable and you can be able to draw it without lifting up your pencil. 

Discontinuity is when the limit of a graph does not exist. A limit does not exist if there are any of these three parts which include jump discontinuity, oscillating discontinuity, and infinite discontinuity. 
The picture on the right shows an example of a jump discontinuity. A jump discontinuity is basically as its name says. The graph will suddenly "jump" from one part of the graph to a higher or lower part of the previous graph. 

The graph right above shows an example of an oscillating discontinuity. An oscillating discontinuity is basically a graph that looks wiggly. For example, on the graph , we can oscillating behavior where the x-axis is 0. 

The graph on the right shows an  example of an infinite discontinuity. An infinite discontinuity is when a graph never reaches an exact endpoint. This can only occur when we see a vertical asymptote. For example, at 3 on the x-axis, we can see a vertical asymptote because the graph do not reach a certain point. 

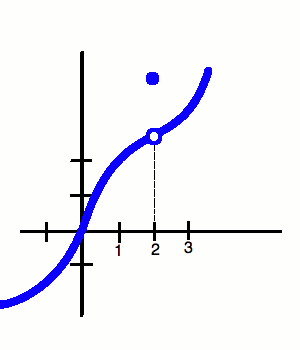
2. A limit is the INTENDED heigh of a function. A limit is completely different form a value because a value is an exact height while a limit can be given a value although there is a hole in the graph which gives it no value. For example, on the graph below, there is a limit at (2,3) although there is a value at (2,4). Therefor the value of f(2) is equal to 3 although there is a hole in the graph. A limit can exist anywhere as long as you specify what location you are trying to find your limit at. A limit does not exist if the graph is not continuous. There cannot be a limit if there is either a jump, oscillating, or infinite discontinuity. 


3.  We can evaluate limits numerically, graphically, or algebraically. 

-Numerically is when we use a table to find a limit based upon how close a function approaches the intended value. On the table, the intended value that the function is approaching will be in the middle. Then there will be three other spaces on the left and right of it. These three values will be the closest to the intended value. For example if the intended value is 3, the values on the left will 2.9 all the way on the left, next with 2.99, hen 2.999. Then, right next to 3 will be 3.001, then 3.01, and finally 3.001. 

-Graphically is basically where you make a graph of the function so you can visually see the intended height of the function.

-Algebraically is when we use actual numbers to solve the function. The first step one should take is use direct substitution. This is when you plug in the value as x approaches a number to the variable x in the function and see if it gives you an exact value, 0, or undefined. If you get 0/0 you will have to use a different method because it is indeterminate form. You can either use the factoring method which involves you to factor out both the numerator and denominator to see if anything cancels out so that you can from then on use direct substitution again to give you an answer. The other method you can use is the rationalizing/ conjugate method which is when you multiply by the conjugate of a radical so that you can look for something to cancel. From there on, you again use direct substitution to get an answer. 


References:
http://808trig.wikispaces.com/file/view/continuous_1.gif/230815466/304x236/continuous_1.gif
http://image.tutorvista.com/content/feed/u364/discontin.GIF
http://webpages.charter.net/mwhitneyshhs/calculus/limits/limit-graph7.jpg
http://www.freemathhelp.com/images/lessons/graph4.gif
http://dj1hlxw0wr920.cloudfront.net/userfiles/wyzfiles/12cf828c-12be-4ace-a420-21bd21aeb8c8.gif


Monday, April 21, 2014

BQ #3: Unit T Concepts 1-3

How do the graphs of sine and cosine relate to each of the others?  Emphasize asymptotes in your response.

Tangent


The graph above shows a picture that has a sine, cosine, and tangent graph all in one. We know that sine is positive in the 1st and 2nd quadrants while cosine is positive in the 1st and 4th quadrants. Apart from this, we also know that the trig ratio for tangent is sine/cosine. So in that case, if both sine and cosine are positive, tangent will be positive. However, if sine is positive while cosine is negative (or vice versa) the tangent graph will be negative which in the end makes the pattern of +-+-. 


Cotangent

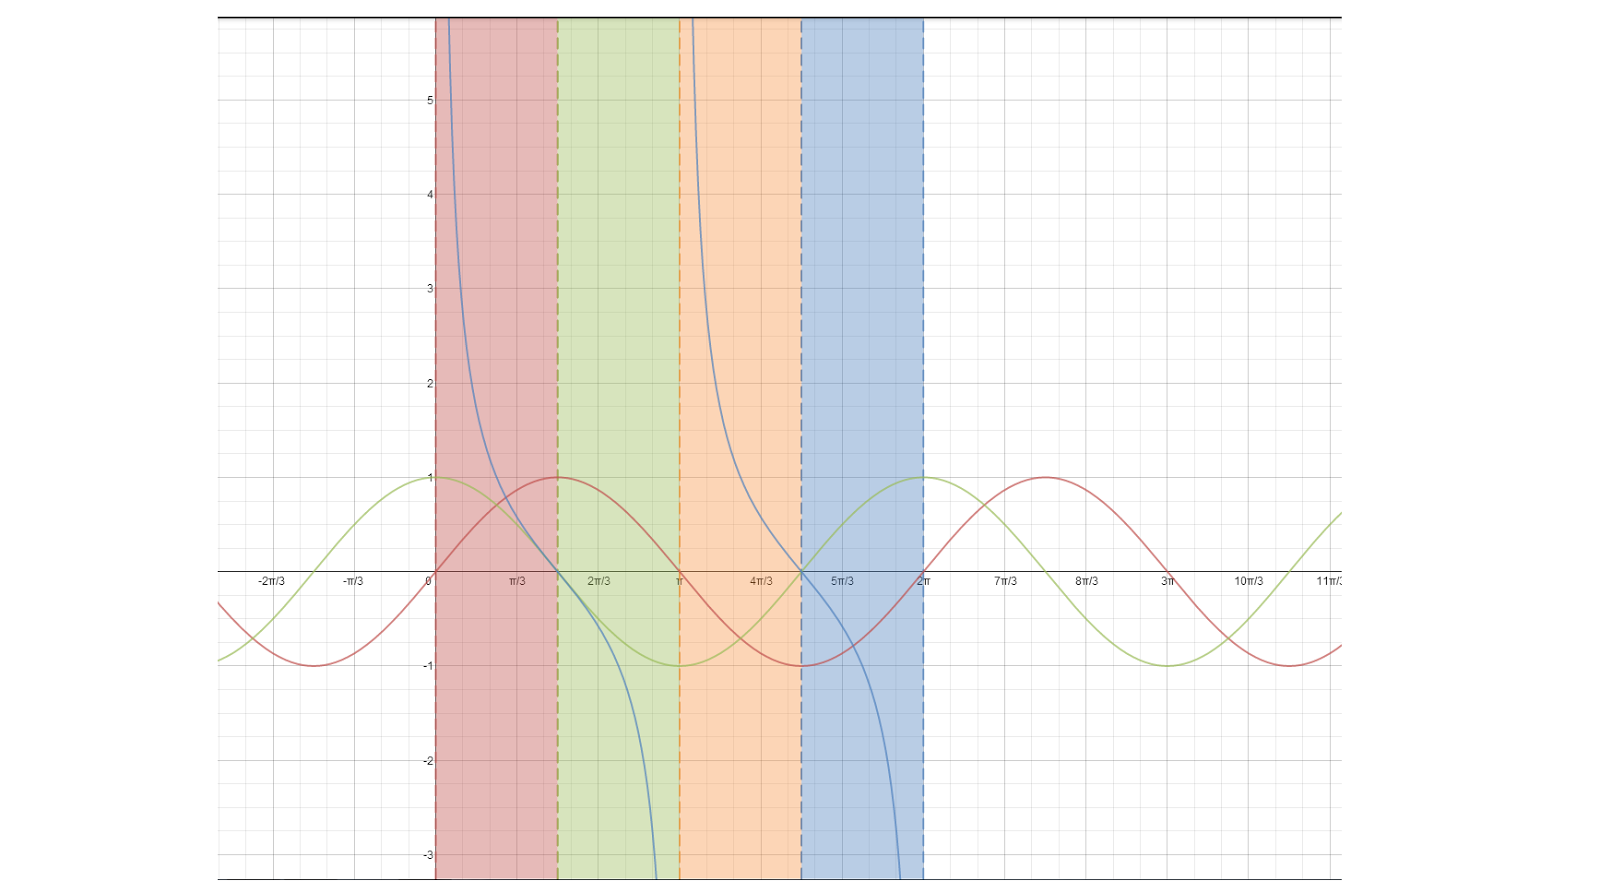
The picture above shows a picture that contains sine, cosine, and now cotangent. Cotangent is basically the same thing as tangent in ways that it contains sine and cosine in its trig ratio. However, cosine is now the numerator and sine is the denominator. Again we must follow the ideas of where each trig function is positive or negative depending on the unit circle so we can know what direction to draw it. Apart from this, the asymptotes for a cotangent graph is different than a tangent graph. 


Secant 


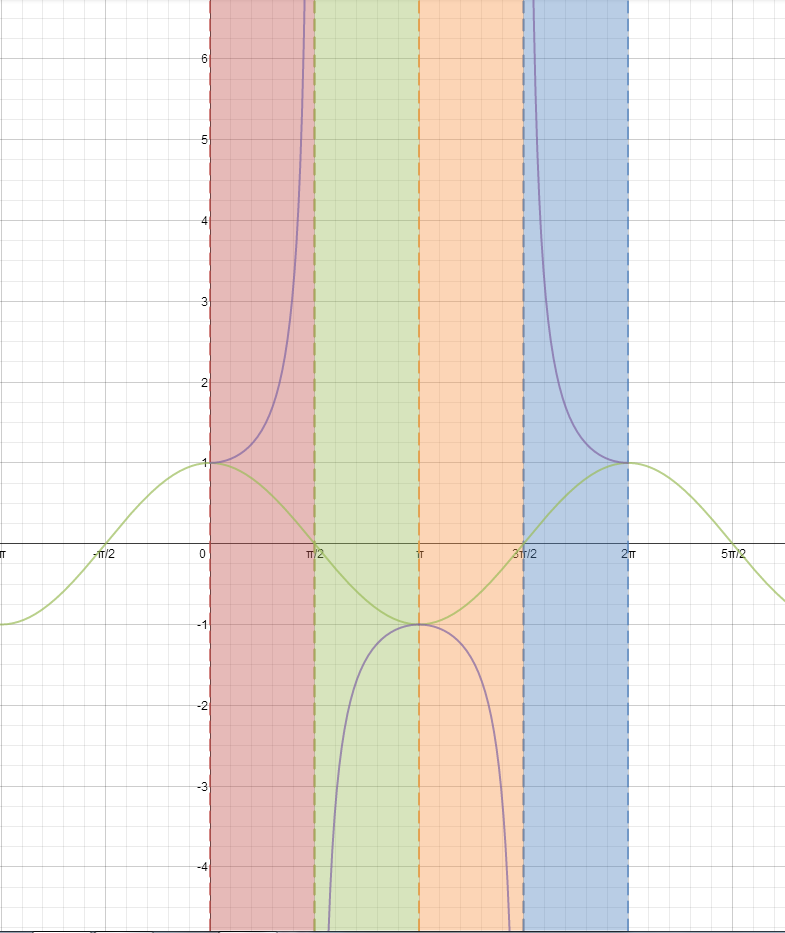
The trig function secant , as we know, is the reciprocal of cosine. This makes its trig ratio be 1/cosine. Since we know that it coexists with cosine, we are able to notice the asymptotes so that we can be able to graph the points and make a graph that looks like the blue line above. 


Cosecant 


For a cosecant graph, we know that the reciprocal for this trig function is sine. Since we know that cosecant coexists with sine, we are able to plot the asymptotes (such as secant) and be able to plot the graph which will always look like the black line. 


References 

https://www.desmos.com/calculator/hjts26gwst

BQ #4: Unit T Concepts 1-3

Why is the "normal" tangent graph uphill but a "normal" cotangent graph downhill? Use the unit circle to explain. 


The picture about shows both the tangent and cotangent graphs. The red graph represents a tangent graph while the blue graph shows a cotangent graph. As we can see, both graphs are going in opposite directions. This is because both graphs have different asymptotes which makes the direction of the graphs different. We know that tangent has a trig ratio of sine/cosine. If we make cosine equal 0,  the asymptotes will lie on 90 and 270 degrees. However, using the trig ratio of cotangent, sine of 0 will land on 0 and 180 degrees. Thus, it makes the asymptotes lie on different locations causing a the directions to be opposite.


References:

http://www.regentsprep.org/Regents/math/algtrig/ATT7/otherg97.gif


Sunday, April 20, 2014

BQ #5 Unit T Concepts 1-3

Why do sine and cosine NOT have asymptotes, but the other trig graphs do? Use unit circle ratios to explain. 

We have learned that trig functions have certain ratios that correspond with them. Sine and cosine do not have asymptotes because because their trig ratios have "r" as their denominator. "R" is always the value of 1 according to the unit circle. This makes it impossible for sine and cosine to have a denominator of 0 which causes an asymptote. Other trig graphs have the possibility of having 0 as the denominator which can create an asymptote. 

BQ #2 Unit T Concept Intro

How do trig functions relate to the Unit Circle?

- Throughout various units, we have witnessed the unit circle have different significances for all units. In this unit we are to notice how the unit circle coexists with trig functions. Trig functions use the unit circle in the way we graph the trig function. We use the unit circle by noticing what quadrants are positive or negative relative to the trig function. For example, sine will be positive in the 1st and 2nd quadrants, so if you unwrap the unit circle,  the graph will be on top of 0 for two quadrants then move t the negative section.


Why is the period for sine and cosine 2pi, whereas the period for tangent and cotangent is pi?


-Sine and cosine have a period of 2pi while tangent has a period of pi. This is because sine and cosine require a whole circle rotation to repeat the pattern they have. For example, sine has a pattern of ++--, while cosine has a pattern of +--+. These patterns indicate that it requires a whole unit circle rotation so that it can repeat. Thus making it 2pi. However, tangent has period of pi because it only requires half a circle to repeat it's pattern. It's pattern is +-+-, which indicates that it only takes half a circle to repeat that pattern which makes it have a period of pi.


How does the fact that sine and cosine have amplitudes of one (and the other trig functions don’t have amplitudes) relate to what we know about the Unit Circle?


-Sine and cosine have amplitudes equal to one because they are the only trig functions that have that restriction. The radius of the unit circle is one, so sine and cosine have a denominator of r which is 1. This makes sine and cosine have a radius of one while all the other trig functions do not have a denominator of 1 to depend on.

Tuesday, April 1, 2014

Reflection #1: Unit Q Concepts 1&5

1. To verify a trig function,  it basically means to make one complex looking trig function into a simpler trig function. When you are "verifying" you will have the final trig function after the equals sign which is your goal to end with after you do different steps.

2. Some tricks or tips that you should use is to basically try to make everything into sine and cosine if possible. If you have everything in sine and cosine, it is an easier passageway to cancel out trig functions, if possible, or create a different trig function using these two trig values. One VERY important tip is to not get frustrated! You will somehow find a way to get through all the steps so be patient!

3. I personally do not have a special process when solving these problems. One step I tend to do is find the best way to start the problem by either multiplying by the conjugate, finding the LCD, splitting the problem, or putting everything into sine and cosine. From there, I search for methods to make trig functions cancel or convert one trig function to another. I continue this process until I finally have my solution.

Wednesday, March 26, 2014

SP: 7 Unit Q Concept 2

This SP7 was made in collaboration with Joshua Nolasco.  Please visit the other awesome posts on their blog by going here.


PROBLEM: tanx= -7/2
sinx>0


The picture above shows various steps on evaluating all the different trig functions when you are only given 2. Follow the steps I have given to understand where each trig function is derived from.


The picture above shows how you can solve the different trig functions when using SOHCAHTOA as the trig ratios.


In order to understand this concept, the viewer must able to recognize all the different trig functions that coexist within one another. Apart from this, the viewer must be able to understand the trig ratios of each trig function so that you can know how the triangle will be pictured as.