Pages

Welcome to Jesus' Math Blog

Welcome to Jesus' Math Blog
Everything you need for Math Analysis is right here!

Monday, May 19, 2014

BQ # 6 Unit U Limits

1. Continuity is when there is a graph that is predictable, meaning that you know what the graph will do, it will not surprise you. Continuity is also when a graph has no breaks, no jumps, no holes that makes the graph look abnormal. a continuous graph can be drawn without lifting up your pencil.  A continuous graph also has it's value and limits equal the same.  The picture below shows various continuous graphs. As you can see, you can notice that all of these graphs are plain and predictable and you can be able to draw it without lifting up your pencil. 

Discontinuity is when the limit of a graph does not exist. A limit does not exist if there are any of these three parts which include jump discontinuity, oscillating discontinuity, and infinite discontinuity. 
The picture on the right shows an example of a jump discontinuity. A jump discontinuity is basically as its name says. The graph will suddenly "jump" from one part of the graph to a higher or lower part of the previous graph. 

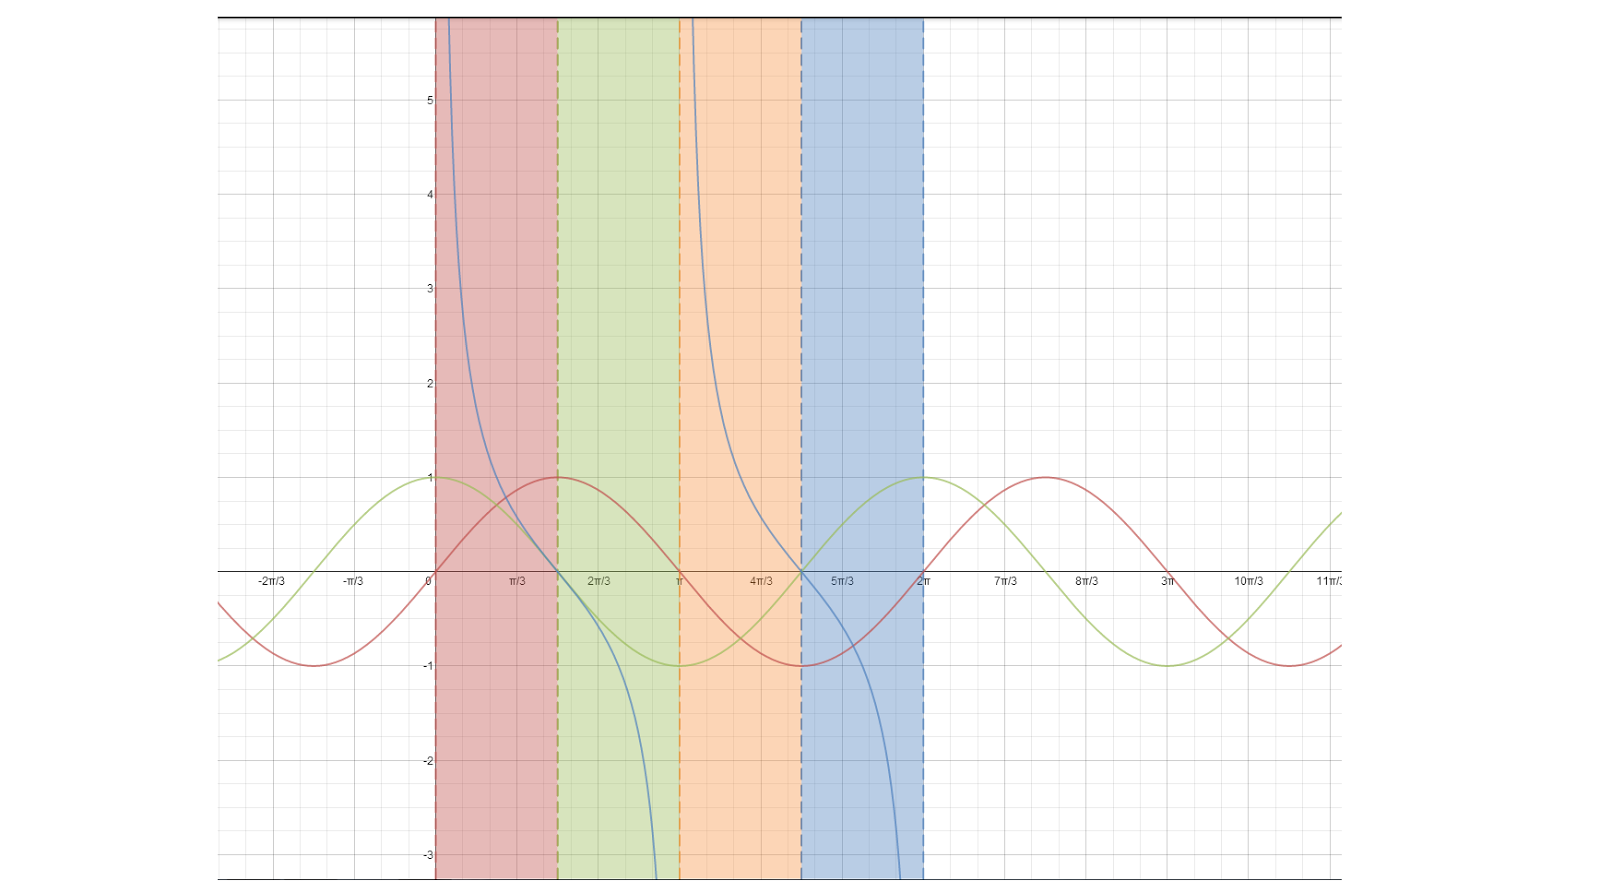
The graph right above shows an example of an oscillating discontinuity. An oscillating discontinuity is basically a graph that looks wiggly. For example, on the graph , we can oscillating behavior where the x-axis is 0. 

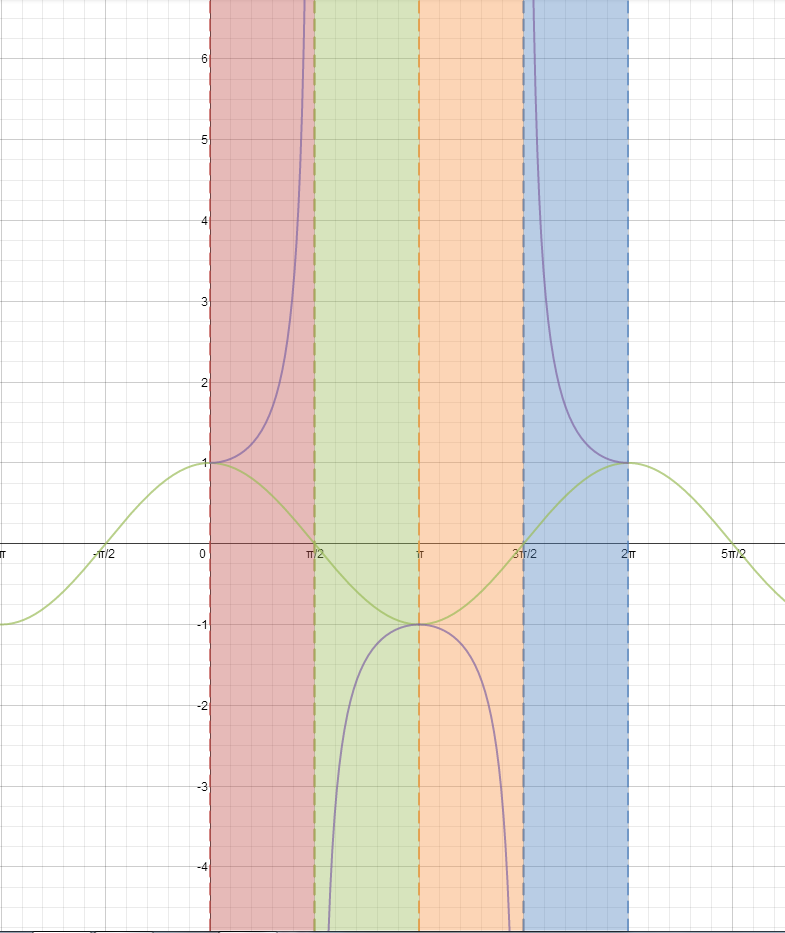
The graph on the right shows an  example of an infinite discontinuity. An infinite discontinuity is when a graph never reaches an exact endpoint. This can only occur when we see a vertical asymptote. For example, at 3 on the x-axis, we can see a vertical asymptote because the graph do not reach a certain point. 

2. A limit is the INTENDED heigh of a function. A limit is completely different form a value because a value is an exact height while a limit can be given a value although there is a hole in the graph which gives it no value. For example, on the graph below, there is a limit at (2,3) although there is a value at (2,4). Therefor the value of f(2) is equal to 3 although there is a hole in the graph. A limit can exist anywhere as long as you specify what location you are trying to find your limit at. A limit does not exist if the graph is not continuous. There cannot be a limit if there is either a jump, oscillating, or infinite discontinuity. 


3.  We can evaluate limits numerically, graphically, or algebraically. 

-Numerically is when we use a table to find a limit based upon how close a function approaches the intended value. On the table, the intended value that the function is approaching will be in the middle. Then there will be three other spaces on the left and right of it. These three values will be the closest to the intended value. For example if the intended value is 3, the values on the left will 2.9 all the way on the left, next with 2.99, hen 2.999. Then, right next to 3 will be 3.001, then 3.01, and finally 3.001. 

-Graphically is basically where you make a graph of the function so you can visually see the intended height of the function.

-Algebraically is when we use actual numbers to solve the function. The first step one should take is use direct substitution. This is when you plug in the value as x approaches a number to the variable x in the function and see if it gives you an exact value, 0, or undefined. If you get 0/0 you will have to use a different method because it is indeterminate form. You can either use the factoring method which involves you to factor out both the numerator and denominator to see if anything cancels out so that you can from then on use direct substitution again to give you an answer. The other method you can use is the rationalizing/ conjugate method which is when you multiply by the conjugate of a radical so that you can look for something to cancel. From there on, you again use direct substitution to get an answer. 


References:
http://808trig.wikispaces.com/file/view/continuous_1.gif/230815466/304x236/continuous_1.gif
http://image.tutorvista.com/content/feed/u364/discontin.GIF
http://webpages.charter.net/mwhitneyshhs/calculus/limits/limit-graph7.jpg
http://www.freemathhelp.com/images/lessons/graph4.gif
http://dj1hlxw0wr920.cloudfront.net/userfiles/wyzfiles/12cf828c-12be-4ace-a420-21bd21aeb8c8.gif


Monday, April 21, 2014

BQ #3: Unit T Concepts 1-3

How do the graphs of sine and cosine relate to each of the others?  Emphasize asymptotes in your response.

Tangent


The graph above shows a picture that has a sine, cosine, and tangent graph all in one. We know that sine is positive in the 1st and 2nd quadrants while cosine is positive in the 1st and 4th quadrants. Apart from this, we also know that the trig ratio for tangent is sine/cosine. So in that case, if both sine and cosine are positive, tangent will be positive. However, if sine is positive while cosine is negative (or vice versa) the tangent graph will be negative which in the end makes the pattern of +-+-. 


Cotangent

The picture above shows a picture that contains sine, cosine, and now cotangent. Cotangent is basically the same thing as tangent in ways that it contains sine and cosine in its trig ratio. However, cosine is now the numerator and sine is the denominator. Again we must follow the ideas of where each trig function is positive or negative depending on the unit circle so we can know what direction to draw it. Apart from this, the asymptotes for a cotangent graph is different than a tangent graph. 


Secant 


The trig function secant , as we know, is the reciprocal of cosine. This makes its trig ratio be 1/cosine. Since we know that it coexists with cosine, we are able to notice the asymptotes so that we can be able to graph the points and make a graph that looks like the blue line above. 


Cosecant 


For a cosecant graph, we know that the reciprocal for this trig function is sine. Since we know that cosecant coexists with sine, we are able to plot the asymptotes (such as secant) and be able to plot the graph which will always look like the black line. 


References 

https://www.desmos.com/calculator/hjts26gwst

BQ #4: Unit T Concepts 1-3

Why is the "normal" tangent graph uphill but a "normal" cotangent graph downhill? Use the unit circle to explain. 


The picture about shows both the tangent and cotangent graphs. The red graph represents a tangent graph while the blue graph shows a cotangent graph. As we can see, both graphs are going in opposite directions. This is because both graphs have different asymptotes which makes the direction of the graphs different. We know that tangent has a trig ratio of sine/cosine. If we make cosine equal 0,  the asymptotes will lie on 90 and 270 degrees. However, using the trig ratio of cotangent, sine of 0 will land on 0 and 180 degrees. Thus, it makes the asymptotes lie on different locations causing a the directions to be opposite.


References:

http://www.regentsprep.org/Regents/math/algtrig/ATT7/otherg97.gif


Sunday, April 20, 2014

BQ #5 Unit T Concepts 1-3

Why do sine and cosine NOT have asymptotes, but the other trig graphs do? Use unit circle ratios to explain. 

We have learned that trig functions have certain ratios that correspond with them. Sine and cosine do not have asymptotes because because their trig ratios have "r" as their denominator. "R" is always the value of 1 according to the unit circle. This makes it impossible for sine and cosine to have a denominator of 0 which causes an asymptote. Other trig graphs have the possibility of having 0 as the denominator which can create an asymptote. 

BQ #2 Unit T Concept Intro

How do trig functions relate to the Unit Circle?

- Throughout various units, we have witnessed the unit circle have different significances for all units. In this unit we are to notice how the unit circle coexists with trig functions. Trig functions use the unit circle in the way we graph the trig function. We use the unit circle by noticing what quadrants are positive or negative relative to the trig function. For example, sine will be positive in the 1st and 2nd quadrants, so if you unwrap the unit circle,  the graph will be on top of 0 for two quadrants then move t the negative section.


Why is the period for sine and cosine 2pi, whereas the period for tangent and cotangent is pi?


-Sine and cosine have a period of 2pi while tangent has a period of pi. This is because sine and cosine require a whole circle rotation to repeat the pattern they have. For example, sine has a pattern of ++--, while cosine has a pattern of +--+. These patterns indicate that it requires a whole unit circle rotation so that it can repeat. Thus making it 2pi. However, tangent has period of pi because it only requires half a circle to repeat it's pattern. It's pattern is +-+-, which indicates that it only takes half a circle to repeat that pattern which makes it have a period of pi.


How does the fact that sine and cosine have amplitudes of one (and the other trig functions don’t have amplitudes) relate to what we know about the Unit Circle?


-Sine and cosine have amplitudes equal to one because they are the only trig functions that have that restriction. The radius of the unit circle is one, so sine and cosine have a denominator of r which is 1. This makes sine and cosine have a radius of one while all the other trig functions do not have a denominator of 1 to depend on.

Tuesday, April 1, 2014

Reflection #1: Unit Q Concepts 1&5

1. To verify a trig function,  it basically means to make one complex looking trig function into a simpler trig function. When you are "verifying" you will have the final trig function after the equals sign which is your goal to end with after you do different steps.

2. Some tricks or tips that you should use is to basically try to make everything into sine and cosine if possible. If you have everything in sine and cosine, it is an easier passageway to cancel out trig functions, if possible, or create a different trig function using these two trig values. One VERY important tip is to not get frustrated! You will somehow find a way to get through all the steps so be patient!

3. I personally do not have a special process when solving these problems. One step I tend to do is find the best way to start the problem by either multiplying by the conjugate, finding the LCD, splitting the problem, or putting everything into sine and cosine. From there, I search for methods to make trig functions cancel or convert one trig function to another. I continue this process until I finally have my solution.

Wednesday, March 26, 2014

SP: 7 Unit Q Concept 2

This SP7 was made in collaboration with Joshua Nolasco.  Please visit the other awesome posts on their blog by going here.


PROBLEM: tanx= -7/2
sinx>0


The picture above shows various steps on evaluating all the different trig functions when you are only given 2. Follow the steps I have given to understand where each trig function is derived from.


The picture above shows how you can solve the different trig functions when using SOHCAHTOA as the trig ratios.


In order to understand this concept, the viewer must able to recognize all the different trig functions that coexist within one another. Apart from this, the viewer must be able to understand the trig ratios of each trig function so that you can know how the triangle will be pictured as.


Friday, March 21, 2014

I/D #3: Unit Q- Pythagorean Identities


1. The equation sin2x+cos2x=1 is derived from the Pythagorean Theorem. The Pythagorean Theorem, as we know, is x^2+ y^2= r^2 when it is compared to the unit circle. To derive the equation given, we must follow the steps given on the picture below. We must first divide by r^2. This will allow us to get certain trig functions. These trig functions will be able to be arranged so that we end up having cos^2 + sin^2=1.


2. To derive the next two pythagorean identities, we must use the first pythagorean identity to get the next two. For the first one, we must divide everything by sin^2. This will create new trig ratios which will soon be simplified to make the new equation cot^2+ 1= csc^2.


To get the next pythagorean identity, we have to start off using the first pythagorean identity that we derived. From here, we must divide the entire equation by cos^2. This will again make new trig functions that will be able to simplified into the new equation, 1+ tan^2= sec^2.


Inquiry Activity Reflection


1. The connections that I see between units N,O,P,& Q so far are that they all basically rely on the Pythagorean Theorem in some way. They all also fall under the concept of the unit circle and the "magic three" ordered pairs.

2. If I had to describe trigonometry in three words, they would be tricky, mind-blowing, and interesting.


Tuesday, March 18, 2014

WPP 13&14: Unit P Concepts 6 and 7


This WPP13-14 was made in collaboration with Vanessa Ceja.  Please visit the other awesome posts on her blog by going here.


Create your own Playlist on LessonPaths!

Sunday, March 16, 2014

BQ #1: Unit P Concepts 1 & 5: Law of Sines and Area of Oblique Triangles

1. Law of Sines

Why do we need it? 

We use the law of sines because it helps us evaluate the side lengths or angles for triangles, in this unit mainly oblique triangles. It is a simple process of evaluating these missing sides by making to proportions based on what we know and what we need. The proportions you will need will be based on the law of sines formula given to the right.


How is derived from what we already know? 


First, we know that triangle ABC is oblique making it have different different side and angle lengths. Since it oblique, we are able to cut the triangle in a section where it makes two right triangles. (as shown on the top picture) This procedure will help us evaluate the height of the triangle as well.

Since we know that Sine is opposite/hypotenuse, we can use both angles A and C to make two trig functions. The two trig functions that came from this triangle are shown on the second picture. (The very top one)

The next step we must take is to cross multiply which makes h remain alone while we have cSinA and aSinC as the two trig functions. We want to have the Angle value the same as its corresponding side so we must divide both functions by ac. This will make the first equation get rid of the "c's" while the other will get rid of the "a's".

Finally, we get what we were looking for which is SinA/a = SinC/c


5. Area Formulas

Do all three area formulas work? 


As we can see on the pictures below, we notice that all three equations are basically the same the same answers. They all have a 12 unit area which proves that all three equations work to find the area of oblique triangles.


Monday, March 3, 2014

ID#2: Unit O Concepts 7-8: How can we derive the patterns for our special right triangles?

Inquiry Activity Summary:

In the activity we did during class, we were supposed to derive the special right triangles making all the sides equal to one. To derive a 45-45-90 triangle, we were given a square with each side equal to 1. From there, we had to divide the square into two parts so that we can have a 45-45-90 triangle and then find the value of the hypotenuse. To derive a 30-60-90 triangle, we were given an equilateral triangle with side lengths equal to 1. We had to again cut the triangle in two parts to get the triangle degrees of 30-60-90. Finally,we found the values of the side missing.


1. When deriving the equilateral triangle, you must cut the triangle in half so that one side can remain as 60 degrees, one can be 90 degrees, and the other one can be 30 degrees since it is half of the triangle. We know that all sides of the equilateral are equal to 1. Since it is cut in half, the bottom side is equal to 1/2. (as shown on the bottom left) The hypotenuse is equal to 1, so we know what a & c are equal to. So to find the value of the height, we must use the pythagorean theorem. My work is shown on the bottom right which gives us the value of the height which is rad 3/2. We know that 

 a 30-60-90 triangle has side values of n, n rad 3, and 2n. The variable "n" is a constant. In this case, our n is 1/2 which gives us these answers but the value of n can vary depending on the problem they give you. But, they all end up falling under the same guidelines. 


2. When deriving a 45-45-90 triangle by an equilateral triangle we must first cut the square diagonally. It must be diagonally because it will create two triangles and also making two 45 degree sides. It can't be cut in the middle because it will make a rectangle. We know that two sides are equal to 1 so we must use the pythagorean theorem, as shown below, to find the value of the hypotenuse. We use "n" to represent our sides because it is a constant. This means that any number will follow the same guidelines for each side we must know. 


Inquiry Activity Reflection: 

1. Something I never noticed before about special right triangles is that the value of the sides are directly connected to equilateral triangles and squares. The value of their sides make sense when you work out the problem to its individual parts.

2. Being able to derive these patterns myself aids in my learning because I finally understand where the values of the sides for special right triangles come from and I am able to see how things are directly connected to one another.


Saturday, February 22, 2014

I/D#1: Unit N Concept 7: How do SRT's and the UC relate?

Inquiry Activity Summary: 
In this activity, we were focusing on how the unit circle and the special right triangles relate to one another when one fills out the unit circle. Once you know the special right triangles and their side values, you are able to find the coordinates for the unit circle.

1. 30* Triangle 

This triangle contains an adjacent side (x), opposite (y), and hypotenuse. On the picture given to the right, the values of each side of the triangle are given. These are the values when it is used to classify a special 30* triangle. On the picture below the first, we are able to see how the values change when it is on a unit circle. To receive these values, you just basically have to divide all the regular values of the special right triangle by two. Since the x value of the unit circle is radical 3 over 2, that becomes your x coordinate while the height is 1/2 making it your y coordinate. The coterminal angles for 30* are 150*, 210*, and 330* .


2. 45* Triangle

A 45* triangle involves having 2 side lengths that are the same length. These two sides can be 1 or just the variable x. The hypotenuse for the special right triangle is radical 2. However, for a unit circle, we want the hypotenuse to equal 1. Therefore, we must divide the side lengths by radical 2 on every single side. Once we work that out, we are able to get the values of both x and y which are radical 2 over 2. To put these into our coordinate plane, we know what the values of x and y are so we just make or coordinate (radical 2 over 2, radical 2 over 2) The coterminal angles for a 45* angle are 135*, 225*, and 315*. 


A 60* triangle and a 30* triangle have basically the same side lengths as one another. The only difference is that the x and y values are switched. Thus making the x equal to 1 while the y is equal to radical 3. Again, for the unit circle we must make the hypotenuse equal to 1. Therefore, we must divide every side length by 2. This makes the x side equal to 1/2 and the y value radical 3 over 2 as shown on the unit circle below.  Since the x is equal to 1/2, we make that as our coordinate while radical 3 over 2 becomes our y coordinate. The coterminal angles of  60* are 150*, 240*, and 300*.


4. This activity helped me derive the unit circle because as long as you learn the first quadrant based on the special right triangles on the unit circle, you know how to fill out the rest of the quadrants. Since we know what the values and coordinates for each reference angle is, we know where to fill in the blank for the unit circle. As long as you know the first quadrant, you able to know the rest of the quadrants because they are basically the same thing! 

5. The triangle drawn in this activity lies on the first quadrant. Once you start moving the different quadrants, the signs for the coordinates start to change. For example, if we fill out the unit circle for the quadrant II, we notice that the x- coordinate becomes negative while the y- coordinate stays positive. 


As you can see above the only thing that seems to change is the signs of the coordinates. This makes sense because if you are on quadrant I, the coordinates will both be positive. On the second quadrant, the x- coordinate will be negative while the y- coordinate will be positive. On quadrant III, both the x and y coordinates will be negative. Finally, on the fourth quadrant, the x- coordinate will be positive while the y-coordinate will be negative. 


Inquiry Activity Reflection: 

The coolest thing I learned from this activity was that to derive the unit circle, you do not have to memorize the whole unit circle. As long as you know the first quadrant, you know how to fill in everything else. 


This activity will help in this unit because I will be able to fill in the unit circle more rapidly during the test as well as help while I am doing concepts 8 and 9 so that I can check my work. 

Something I never realized before about special right triangles and the unit circle is that both these two concepts are completely alike. The unit circle is made of special right triangles which allows us to know where the coordinate are derived from. 


Monday, February 10, 2014

RWA #1: Unit M Concept 5a: Ellipses

1. Definition: "The set of all points such that the sum of the distance from two points is a constant."

http://www.lessonpaths.com/learn/i/unit-m-conic-section-applets/ellipse-drawn-from-definition-geogebra-dynamic-worksheet

2. Description:

Algebraically- There are two equations which ellipses can be written as which are
                        (x-h)^2/a^2 + (y-k)^2/ b^2 =1 or (x-h)^2/b^2 + (y-k)^2 / a^2 =1


Graphically-  On a graph, an ellipse looks like an outstretched circle either looking skinny or fat. There 
                      is a major axis and a minor axis. On the major axis, there are two points called the foci 
                      and two vertices. On the minor axis, there are two points known as the co-vertices. 


Key Parts: 

Above there is a sketch of an ellipse. We can see that it is a "fat" ellipse  so therefore we know "a^2" is going to be the first denominator. We know what the center of an ellipse is by using the (h,k) rule on the standard equation. Based on the denominators, we know what "a" is depending if its value is larger than the other denominator. The larger value is "a", therefore making the other value "b." To find these on the graph, it basically all depends whether it is horizontal or vertical. A and B will be the distance away from the center, reaching to the vertex or co-vertex. To ind "c" we must use the equation a^2 - b^2 = c^2. From there, you are able to find the eccentricity by using c/a. 

Foci/eccentricity: 

To find c, we know that we must use the equation a^2 - b^2 = c^2. Now that yo have the value of c, you divide that over a which gives you your eccentricity. Your eccentricity should be greater than 0 but less than 1. The foci will always be on the major axis and be inside the ellipse, not outside. 

3. Real World Application 

The most well known example of an ellipse can be the orbit of satellites such as the earth. We are able to see how the rotation of the earth around the sun is in an elliptical pathway. The rotation of the sun creates the four different seasons we experience. In the video it says, "In the spring equinox, the overhead sun is over the equator which receives the most amount of solar radiation." http://www.youtube.com/watch?v=WLRA87TKXLM  In an article it says, " Earth's orbit is almost a circle, it has an eccentricity less than 0.02."  http://www.universetoday.com/61202/earths-orbit-around-the-sun/ With this we know that the orbit of the earth is not a perfect circle because the eccentricity is more than 0 making it an ellipse.


4. Works Cited: 

http://www.universetoday.com/61202/earths-orbit-around-the-sun/
http://www.youtube.com/watch?v=WLRA87TKXLM
http://www.lessonpaths.com/learn/i/unit-m-conic-section-applets/ellipse-drawn-from-definition-geogebra-dynamic-worksheet